Trending Stock :8th Jun 2026: IdeaForge Technical Analysis – Drone Stock Soars to New Heights
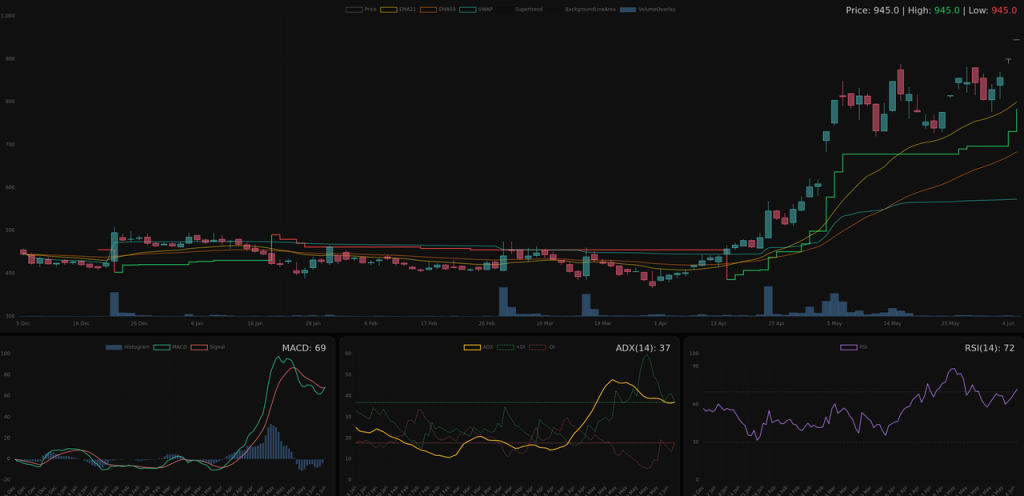
The Indian stock market has a new high-flier, and it is literally in the business of flight. IdeaForge Technology Limited, India’s leading unmanned aerial vehicle (UAV) manufacturer, is currently trading around ₹945.00, marking an impressive 5% gain in the latest session. After months of consolidation, this drone stock has taken off dramatically, and the technical indicators suggest the rally may have further room to run.
Let’s break down what is happening with this defense and security sector darling.
Company Overview: India’s Drone Pioneer
Before diving into the charts, it is worth understanding what makes IdeaForge special. Incorporated in 2007 and founded by IIT Bombay alumni, IdeaForge is the pre-eminent market leader in the Indian Unmanned Aircraft Systems industry. The company designs and manufactures best-in-class drones for defense, homeland security, disaster response, and industrial applications.
With India’s increasing focus on indigenous defense manufacturing and recent news of massive government procurement plans for drones, IdeaForge is perfectly positioned to capitalize on this opportunity.
The Technical Breakdown
Price Action: From Consolidation to Explosion
Looking at the daily chart from late 2025 through mid-2026, IdeaForge exhibited a classic accumulation pattern. The stock traded in a tight range between ₹400 and ₹500 for nearly four months. This sideways movement is typical of institutional accumulation, where smart money builds positions without pushing the price higher.
The breakout came in mid-April, when the stock decisively moved above the ₹500 resistance level. What followed was a parabolic rally that has taken the stock to ₹945 – a gain of over 130% from the breakout point.
Moving Averages: Bullish Alignment
The moving average setup is textbook bullish:
- Price is trading well above all major moving averages.
- EMA21 (Yellow line) is sloping sharply upward and acting as dynamic support.
- EMA50 (Orange line) is rising steadily, confirming the medium-term uptrend.
- VWAP (Teal line) is below the current price, indicating buyers are in control.
The fact that the shorter-term EMA21 is above the longer-term EMA50, with both trending upward, confirms strong momentum. This alignment is what trend traders look for.
Supertrend Indicator: Green Light
The Supertrend indicator (the green stepped line) flipped from red to green in mid-April, coinciding perfectly with the breakout. This indicator has remained green throughout the rally, with the stepped support levels rising consistently. The current Supertrend support sits around ₹680-700, providing a significant cushion below the current price.
As long as the price stays above this Supertrend line, the trend remains firmly bullish.
MACD: Momentum Recharging
The MACD reading tells an interesting story. During the May consolidation phase, the MACD histogram dipped into negative territory, and the MACD line crossed below the signal line – a bearish divergence. However, look at what is happening now:
- The histogram bars are turning positive and growing.
- The MACD line has crossed back above the signal line.
- Both lines are curling upward aggressively.
This bullish crossover suggests that the brief correction is over and momentum is building for the next leg up.
ADX: Trend Strength Returning
The Average Directional Index (ADX) reading of 37 is particularly significant:
- ADX above 25 indicates a strong trend.
- The current reading of 37 shows the trend is gaining strength.
- After peaking near 50 during the initial breakout, ADX had declined to the 20-25 range during the May consolidation.
- Now it is curling back up, suggesting a new strong trend phase is beginning.
More importantly, the positive directional indicator (+DI) is rising sharply while the negative directional indicator (-DI) is falling. This bullish divergence confirms that buyers are firmly in control.
RSI: Strong but Not Stalled
The Relative Strength Index (RSI) stands at 72, which technically falls into “overbought” territory (above 70). However, context matters:
- In strong trending markets, RSI can remain overbought for extended periods.
- The RSI bounced strongly from the 50-55 level during the May dip, showing robust buying interest.
- An RSI of 72 in an uptrend is often a sign of strength, not weakness.
The key thing to watch is whether RSI can hold above 60 on any pullback – that would confirm the uptrend remains intact.
Volume Analysis: Institutional Footprints
The volume bars at the bottom of the chart reveal important clues. There was a massive volume spike in late December, likely representing institutional positioning. Another volume surge occurred in late February, showing accumulation continuing. The breakout in mid-April came with above-average volume, confirming the move. Recent volume has been steady, not declining, suggesting sustained interest.
Key Support and Resistance Levels
Support Levels:
- Immediate Support: ₹900-910 (recent consolidation)
- Major Support: ₹800-820 (previous resistance, now support)
- Strong Support: ₹680-700 (Supertrend level)
- Critical Support: ₹600 (EMA50 area)
Resistance Levels:
- Immediate Resistance: ₹950-960 (current highs)
- Psychological Resistance: ₹1,000 (major milestone)
- Next Target: ₹1,100-1,150 (if ₹1,000 breaks)
The Bull Case vs. The Cautionary View
The Bull Case: Several factors support a continued uptrend. The stock has broken out of a multi-month consolidation with strong volume. All major indicators confirm a strong uptrend, and momentum is accelerating. Furthermore, India’s defense sector is experiencing unprecedented growth, and IdeaForge is the dominant player in this space.
The Cautionary View: Smart traders should be aware of potential risks. The RSI at 72 suggests the stock may be due for a breather. The sharp rise from ₹500 to ₹945 in less than two months is unsustainable long-term, meaning early investors sitting on massive gains may start booking profits.
Trading Strategy
For Trend Followers: Hold existing positions with a trailing stop-loss at ₹850. Add on dips to ₹880-900 with a stop-loss at ₹840. Target ₹1,000-1,050 in the near term.
For New Entrants: Wait for a pullback to ₹880-900 before entering. Use a stop-loss of ₹840 (below recent support) and position size conservatively given the elevated RSI.
Final Verdict
IdeaForge is a strong buy on dips with a positive medium-term outlook. The technical indicators align bullishly, the trend is strong, and the sector tailwinds are powerful. However, traders should respect the overbought RSI and avoid chasing at current levels.
The ideal strategy is to wait for a pullback to the ₹880-900 zone, use appropriate stop-losses, and ride the trend higher. The psychological ₹1,000 mark is the next major milestone, and a break above that could open the door to ₹1,100 and beyond.
Disclaimer: This technical analysis is for educational purposes only and does not constitute financial advice. Always conduct your own research and consult with a qualified financial advisor before making investment decisions.