Trending Stock Today: HSCL Technical Analysis – A Breakout to Watch : 8th Jun 2026
The markets are always moving, but every now and then, a stock chart paints a picture of a classic, powerful trend that demands attention. Today, we are looking at HSCL, a stock that has recently shaken off a long period of consolidation to deliver a massive rally, and it looks like it is gearing up for another leg higher.
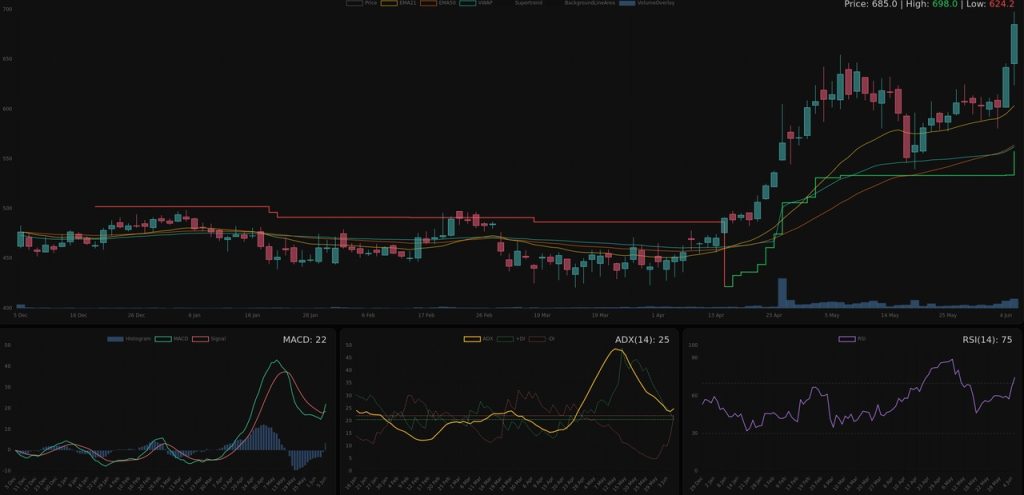
With the current price hovering around 685.0 and hitting a recent high of 698.0, let’s dive into the technicals to understand what is driving this move and what traders should watch for next.
The Big Picture: From Slumber to Surge
If you look at the daily chart from December through early April, HSCL was essentially asleep at the wheel. The stock was caught in a tight consolidation range, bouncing between roughly 440 and 500. This is what technical analysts call an “accumulation phase.” Smart money was likely quietly building positions while the price action remained choppy and directionless.
The wakeup call happened in mid-April. The stock broke out of this multi-month range with conviction. You can see the Supertrend indicator (the green stepped line at the bottom of the main chart) flip from red to green around April 13th, signaling a major shift in trend. This triggered a massive rally that pushed the price from the 470s all the way up to the 640s by early May.
The Pullback and the Re-Acceleration
No stock goes up in a straight line. After the initial surge, HSCL experienced a healthy correction in mid-May, pulling back to the 550 level. This is where the moving averages did their job. The price found support near the EMA50 (Orange line) and the VWAP (Teal line), proving that the medium-term trend was still intact.
Now, in early June, the stock has roared back to life. It has not only recovered its losses but is pushing into uncharted territory, testing the 700 psychological level.
Indicator Breakdown
To confirm if this move has legs, we have to look under the hood at the momentum indicators.
1. Moving Averages (EMA21 & EMA50) The trend is undeniably bullish. The price is trading well above both the 21-day EMA (Yellow) and the 50-day EMA (Orange). Furthermore, the shorter-term EMA is above the longer-term EMA, and both are sloping upwards. This “fanned out” alignment is the hallmark of a strong uptrend. As long as the price stays above the yellow EMA21 line, the short-term momentum is extremely strong.
2. MACD (Moving Average Convergence Divergence) The MACD panel shows an interesting story. During the May pullback, the MACD lines crossed bearishly, and the histogram dipped into the negative (blue bars below the zero line). However, look at the far right of the MACD chart. The histogram bars are shrinking and turning positive again, and the MACD line is curling up to cross the signal line. This suggests that the selling pressure is exhausted and buyers are stepping back in.
3. RSI (Relative Strength Index) The RSI is currently sitting at 75. This is a double-edged sword. On one hand, an RSI above 70 indicates “overbought” conditions, which usually warns of a potential pullback. On the other hand, in strong trending markets, RSI can stay overbought for a long time as momentum fuels the price higher. The fact that RSI has bounced sharply from the 50-level back to 75 shows immense buying strength.
4. ADX (Average Directional Index) The ADX is currently at 25. The ADX measures the strength of a trend, not the direction. An ADX below 20 usually means a ranging market, while above 25 indicates a strong trend. The ADX had spiked to nearly 50 during the first rally and then crashed as the stock consolidated. Now, it is curling back up toward 25. Simultaneously, the +DI (Green dotted line) is rising while the -DI (Red dotted line) is falling. This is a classic “bullish crossover” setup, suggesting a new strong trend is beginning.
Volume Confirmation
You cannot ignore the volume bars at the bottom of the main chart. The initial breakout in late April was accompanied by a massive spike in volume (the tall blue bar). Volume has been steady during the recent push to new highs. Increasing volume on up-days confirms that institutional money is supporting this move.
Conclusion: The Outlook for HSCL
HSCL is a textbook example of a “breakout, pullback, and continuation” pattern.
- The Bull Case: The trend is your friend here. With the Supertrend green, price above all major moving averages, and ADX signaling a strengthening trend, the path of least resistance is up. A break above the recent high of 698.0 could open the door to the 720-750 range.
- The Caution: The RSI at 75 suggests the stock is running hot. Traders should be cautious of chasing the price right at the top. A minor pullback to the EMA21 (around the 600-610 level) would offer a safer entry point.
For now, HSCL is firmly in the driver’s seat, and the technicals suggest the engine is just getting warmed up.
Disclaimer: This is a technical analysis for educational purposes only and does not constitute financial advice. Always do your own research before trading.